Monitoring
@since 11.1.0
Monitoring agenda is available under ``System`` - ``Monitoring`` main menu.
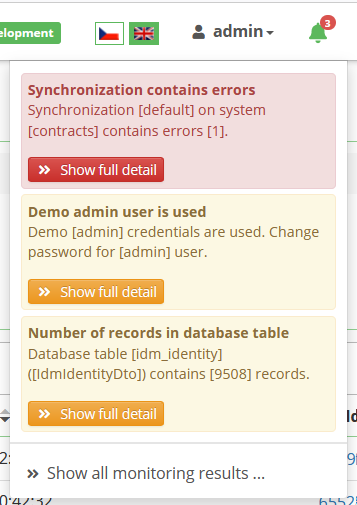
Agenda shows monitoring results and configured monitoring evaluators. Configured evaluators creates monitoring results about CzechIdM application state (e.g. synchronization is running, contains errors). Each evaluator provides one monitoring result. Last monitoring results (by monitoring evaluator) with warning and error level are shown in top navigation:
Monitoring evaluator can be provided from custom module.
Common monitoring evaluator configuration properties:
- Instance - Monitoring will be evaluated (executed) on server (instance identifier). This is usable, when result is related to server instance (H2 database usage, available disk space etc.).
- Delay [s] - Delay in seconds between new monitoring evaluation. 0s - monitoring will be evaluated, when server instance is started only or no other monitoring result is found (after monitoring is created / enabled).
- Valid from - First fire time will be related to given date - delay will be applied after.
- Order - Order is used in monitoring evaluation - e.g. quick monitoring evaluation can be executed before slower one ⇒ some monitoring result will be available.
- Disabled - Monitoring evaluator can be disabled - monitoring is not evaluated automatically and monitoring result is not shown in last monitoring result (~ warning is hidden).
Custom module can define additional configuration properties, which are required by evaluator implementation.
Product provided monitoring evaluators
H2DatabaseMonitoringEvaluator
Warning about H2 database usage ⇒ H2 database is not supposed to be used for production environment.
DemoAdminMonitoringEvaluator
Warning about demo admin credentials are used.
DatabaseTableMonitoringEvaluator
Warning about too many records in database table.
Parameters
- Threshold (
threshold) - Warning will be shown, when number of records in database table will be higher. - Database table (
service-bean-name) - Checked database table (checked type of record).
SynchronizationMonitoringEvaluator
Check synchronization execution.
Parameters
- Synchronization (
synchronization) - Checked synchronization.
Synchronization monitoring auto configuration
Synchronization monitoring evaluator is created / deleted automatically after synchronization configuration is created or deleted.
# disable / enable processor
idm.sec.acc.processor.acc-sync-config-monitoring-auto-configuration-processor.enabled=false
ProvisioningOperationMonitoringEvaluator
@since 11.2.0
Warning about errors in provisioning queue.
Parameters
- Number of days (
numberofdays) - Errors not older than given number of days.
EntityEventMonitoringEvaluator
@since 11.2.0
Warning about errors in event queue.
Parameters
- Number of days (
numberofdays) - Errors not older than given number of days.
EntityEventLockQueueMonitoringEvaluator
@since 12.1.0
Check, that not too many threads are waiting for entity event lock. CzechIdM only allows a single thread at a time to access the entity event queue. Having too many threads waiting for this lock may indicate some problems with the environment.
Parameters
- Number of days (
numberofdays) - Errors not older than given number of days.
LongRunningTaskMonitoringEvaluator
@since 11.2.0
Warning about errors in long running task queue.
Parameters
- Number of days (
numberofdays) - Errors not older than given number of days.
LongRunningTaskResultMonitoringEvaluator
@since 12.1.0
Warning about errors in processed items in long-running tasks. This monitoring fails for tasks, that contain failed items among their processed items no matter the result of the task itself.
Parameters
- Number of days (
numberofdays) - Errors not older than given number of days.
LoggingEventMonitoringEvaluator
@since 11.2.0
Warning about errors in logging events.
Parameters
- Number of days (
numberofdays) - Errors not older than given number of days.
Example security setting
Person - monitoring configurer
Person can configure monitoring evaluators, read and update monitoring results.
Set the role authorization policies as follows:
- Monitoring - settings (IdmMonitoring) | Administration (all) | BasePermissionEvaluator
- Monitoring - results (IdmMonitoringResult) | Read, Update | BasePermissionEvaluator
Person - monitoring result reader
Person can read monitoring results (~ read application state).
Set the role authorization policies as follows:
- Monitoring - settings (IdmMonitoring) | View in select box (autocomplete) | BasePermissionEvaluator
- Monitoring - results (IdmMonitoringResult) | Read | BasePermissionEvaluator
Rest usage
Examples of execute and get monitoring results. You can use swagger for run examples bellow or to find atry all available endpoints for monitoring.
Monitoring code can be configured for user frienlty rest url. Uuid monitoring identifier is required otherwise.
Examples bellow uses demo admin/admin credetials and IdM runs on localhost.
Execute monitoring
curl -X PUT "http://localhost:8080/idm-backend/api/v1/monitorings/provisioning-queue-monitoring/execute" -H "accept: */*" -H "authorization: Basic YWRtaW46YWRtaW4="
Execute monitoring synchronously and get the current result as IdmMonitoringResultDto in json.
Get last monitoring result
curl -X GET "http://localhost:8080/idm-backend/api/v1/monitorings/provisioning-queue-monitoring/last-result" -H "accept: */*" -H "authorization: Basic YWRtaW46YWRtaW4="
Get the last result as IdmMonitoringResultDto in json.
Get all last monitoring results
curl -X GET "http://localhost:8080/idm-backend/api/v1/monitoring-results?lastResult=true&size=500" -H "accept: */*" -H "authorization: Basic YWRtaW46YWRtaW4="
Future development
- Notification ~ report about last monitoring results each day. First version of this report is the Monitoring report (core-monitoring-report) which can be scheduled and sent to the recipients configured in the specific notification configuration (topic) - see Send notification
